When trading and investing, it’s essential to research in advance before purchasing any digital asset properly. In addition to plans, how improvements are brought to specific industries are working, and technical analysis plays a vital role in finding out details about an asset.
Furthermore, the technical analysis represents the action of tracking the price of an asset because the general belief in the equity or cryptocurrency market is that history repeats itself. The cost of an investment may fluctuate a lot, especially in the cryptocurrency market, and it’s important to observe why the price gap is occurring, where the real value is, and how to purchase at a discounted price to obtain the profit we’re aiming for.
How to technically analyze a price chart?
For an accurate technical analysis that suits our trading and risk profile, it’s essential to know:
- our weak points
- the mistakes we tend to repeat
- what and how much we want from a specific trade
- and the timeframe
After every factor mentioned above is decided and we find assets that we consider valuable, that’s when we proceed to track the price chart. Technical analysis is not as complicated as it seems because we use all indicators to predict the price’s future movements. However, it’s important to mention that such a technical activity should be carried out with fundamental analysis – and still doesn’t guarantee that the history will repeat and that the price is predictable. Nobody can accurately predict the price, especially if a recession is looming.
What are trading indicators, and what do they show?
Trading indicators are mathematic calculus represented through lines on the asset’s price chart. These indicators can help us identify all kinds of opportunities in the market and give us details about the current trend, how long the market can continue like that, where support and resistance levels are found, and so on. In addition, we can determine good entry and exit points depending on the asset’s short or medium-term evolution. Besides the time window, we’re interested in it. Considering the world’s economic cycle and that specific asset’s past cycles is essential.
What is Stochastic RSI?
Stochastic RSI is a technical indicator used in analyses combining the Stochastic Oscillator with the Relative Strength Index (RSI). Instead of analyzing the whole price history, it focuses on a more reasonable period based on the specific asset’s performance. The simple RSI is a derivative of the price, while the Stochastic RSI is a derivative of the RSI, not the direct cost. The mentioned combination makes the analysis punctual and precise, rather than using these indicators separately. In addition, the indicator is used to compare the asset’s price range with its closing prices – all of this to figure out when the price is about to change its course.
How is it helping us, more precisely?
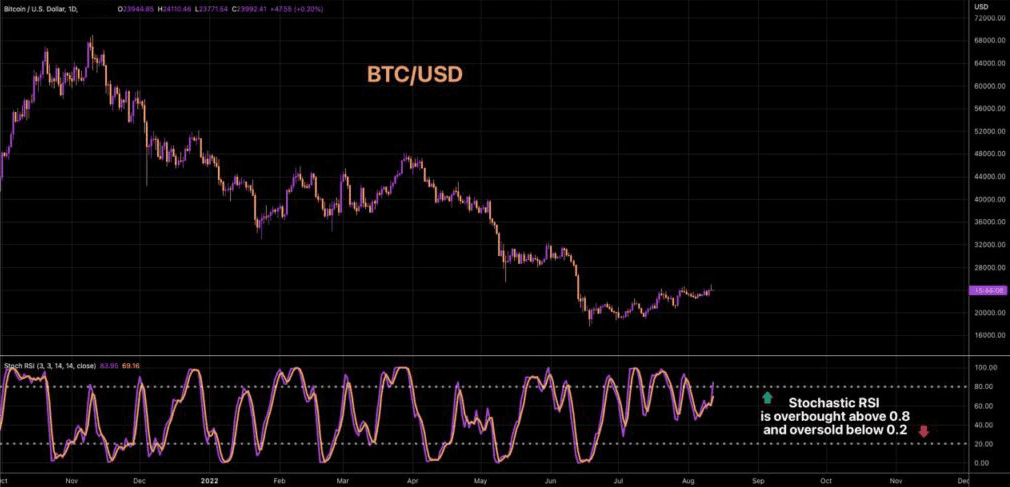
As mentioned above, traders are trying to analyze the closing prices of an asset over a specific period to predict where the trend will change and profit from it. This way, traders can improve their trading strategies using better entry and exit levels. Stochastic RSI tells us if that specific asset is overbought or oversold – and where this status can change. If an asset is overbought, its price is probably overestimated and higher than its actual value. Thus, the trader should sit tight and build a solid strategy while setting alarms and notifications for when the price will visit our desired levels. The indicator’s value fluctuates between 0 and 1, and the last two ends represent price exaggerations:
- 0.2 and below: the asset is oversold, and the price might be undervalued
- 0.8 and above: the asset is overbought, and the price might be overvalued
The Stochastic RSI indicator can be used alongside other indicators, like the Moving Average, to stabilize it. Besides this, it’s recommended to always check an asset from multiple angles and points of view.
A secure, reliable, and easy-to-use exchange platform is another important asset to ensure your crypto journey goes smoothly. Your Friendly Crypto Exchange has over 400 cryptocurrencies and around 1000 pairs for you to trade. Register on IXFI and discover the endless possibilities.
Disclaimer: The content of this article is not investment advice and does not constitute an offer or solicitation to offer or recommendation of any investment product. It is for general purposes only and does not consider your individual needs, investment objectives, and specific financial and fiscal circumstances.
Although the material contained in this article was prepared based on information from public and private sources that IXFI believes to be reliable, no representation, warranty, or undertaking, stated or implied, is given as to the accuracy of the information contained herein, and IXFI expressly disclaims any liability for the accuracy and completeness of the information contained in this article.
Investment involves risk; any ideas or strategies discussed herein should therefore not be undertaken by any individual without prior consultation with a financial professional for the purpose of assessing whether the ideas or strategies that are discussed are suitable to you based on your own personal financial and fiscal objectives, needs, and risk tolerance. IXFI expressly disclaims any liability or loss incurred by any person who acts on the information, ideas, or strategies discussed herein.